The “strace” is a Linux command-line utility that is a useful and powerful tool to capture, monitor, and troubleshoot the programs in a system. It records and intercepts the system calls, which is quite helpful when some program crashes and does not execute as expected.
The “strace” command tool prints how the program operates and communicates with the system. Through this, the user can easily decipher where the errors are occurring while loading the program.
The “ltrace” command is a UNIX system utility that is quite similar to the “strace” command, the difference is that it captures the dynamic calls of shared libraries. The “ltrace” command tool is not a useful tool to trace statically linked libraries.
The syntax of the “strace” command is:
strace [options…] [command]
How to Install “strace” Command?
The “strace” is a built-in tool in Linux systems, but if it is not pre-installed on the machine, type the given command in the terminal:
$ sudo apt install strace
How to Use “strace” Command Options?
Execute the given options to check the working of “strace” command:
Tracing System Calls
To trace the list of all system calls of the system, execute the “strace” command with the “df” command in a terminal:
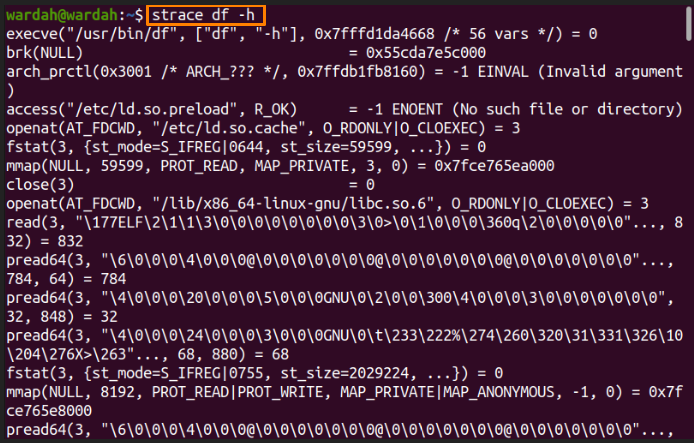
(The “-h” option will display output in human-readable format)
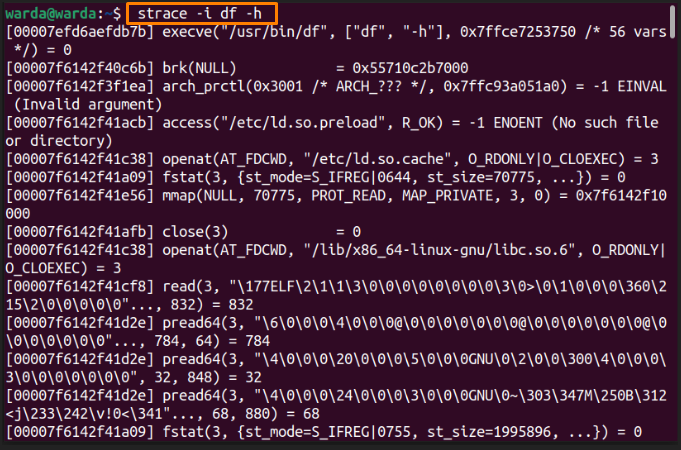
Instruction Pointer during System Calls
To display the instruction pointer while each system call of the program is listed in the terminal, use the given command:
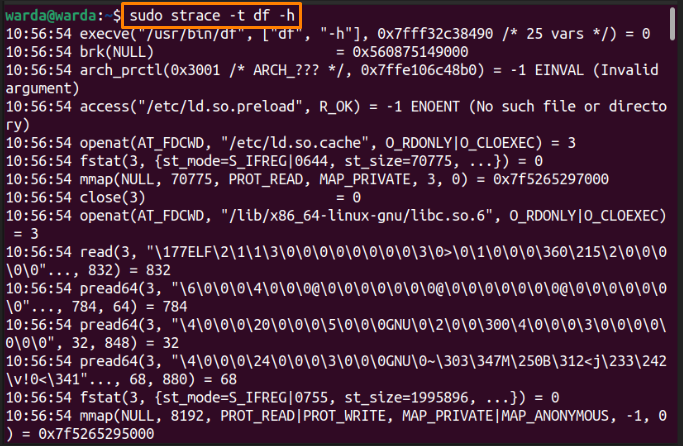
Time of Trace Output
To display the clock time of the day for the tracing output in every single line, type the “-t” option with the given command:
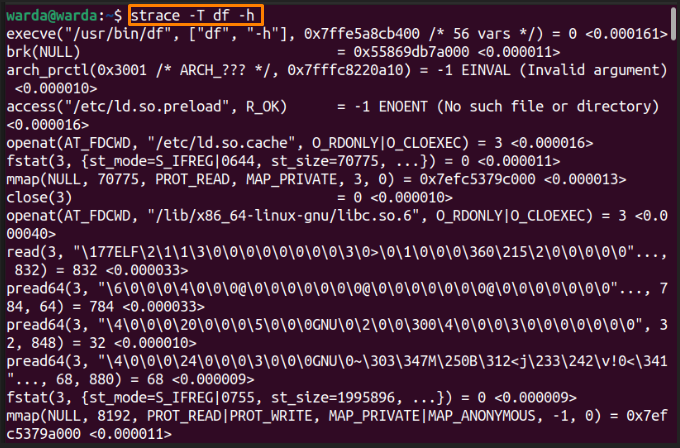
Time Consumed in System Call
Run the “-T” option in the command-line to display the time
consumed of each system call, which includes its starting and ending time:
Trace Specific System Calls
In the above sections, we have seen the lists to trace system calls, but if you want to trace specific system calls, do it through the “-e” option using the following ways:
Supposed you would like to trace the system calls of “read”, the command would be:
$ sudo strace –e trace=read df –h
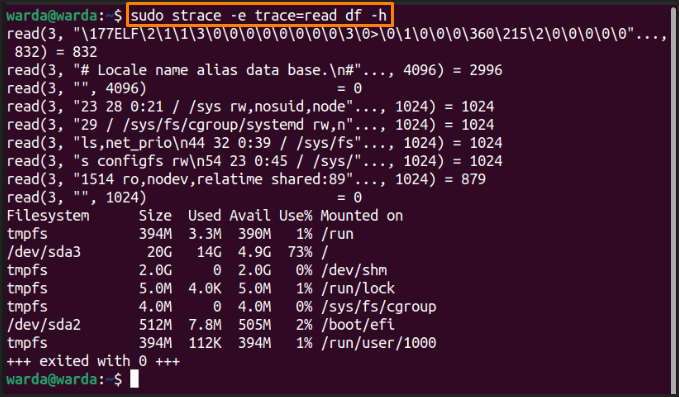
Here, trace is termed as “qualifier” and the “read” is its value.
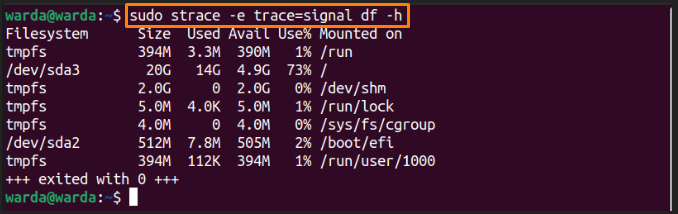
To trace the system call of qualifier value “signal”, type the command:
$ sudo strace -e trace=signal df -h
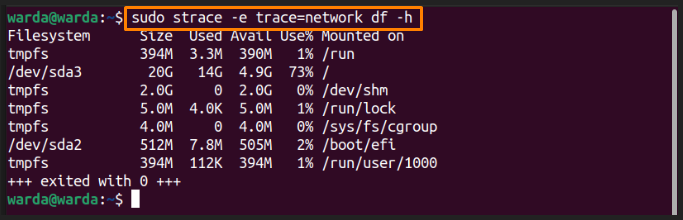
To trace the system calls of qualifier value “network”, type:
$ sudo strace -e trace=network df –h
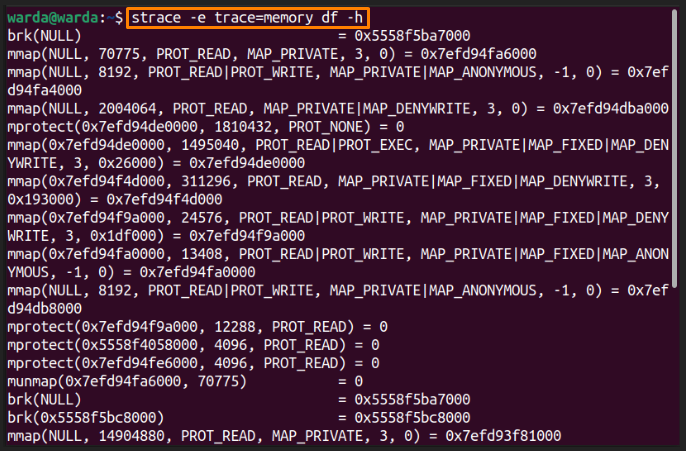
To trace all the system calls that include “memory”, type:
$ strace -e trace=memory df -h
(NOTE: Some of the actions need “sudo” privileges to function while some can be done without it).
Conclusion
The “strace” command is a UNIX utility used to trace system calls and libraries. Through the “strace” command, you can monitor and capture the system calls to troubleshoot the program issues. The “ltrace” command is similar to the “strace” command but it doesn’t capture the statically linked libraries.