Htop is one of the greatest task managers for Linux systems. Okay, I am a little biased as I have actively contributed to its code. However, I think we can agree that htop is a great tool for monitoring and understanding what is going on in our Linux system.
If you are not familiar with htop, do not worry. In this tutorial, I will introduce you to htop, show you how it works, how you can use it, and finally, I’ll show you what the output it gives you means and how to use it.
Pre-requisites
Before we proceed with the tutorial, you will need the following requirements to follow along: A Linux distribution; Root user or user with sudo privileges; Network connection
With all the requirements met, we can proceed.
What is htop?
Let us ask Linux what htop is:
Hisham’s top, commonly called htop, is an interactive system monitor and process manager. I like to think of it as the gateway to the underworking of the Linux processes and system resources.
It was originally developed to be an alternative to the top utility, and thus, it offers similar functionality and so much more. For example, it allows you to interact with the processes and perform functions such as search processes, filter by users, expand parent and children process in a tree format, sorting, etc. In addition, Htop uses colors to indicate various resource usage and provide a much better visual understanding of system statistics.
Another standout feature of htop is that it’s lightweight and super fast. Hisham Muhammad, who I think is a great programmer, wrote in C programming language, htop can fetch system information and analyze the data quickly. This was one of the top drawbacks, which showed a significant time delay between the utility startup and resource statistics.
Installing Htop
Before we can start using htop, we need to make sure we have it installed. Although some distributions do come with the tool pre-installed, this is not always a guarantee.
To confirm you have htop installed, use the command:
If you have htop installed, the command above should show you the path to the htop binary as shown in the output below:
If you do not have htop installed already, use the commands provided below:
Debian/Ubuntu
On Debian and Debian based systems, use the command:
sudo apt-get install htop -y
Manjaro/Arch
On Arch-based distros, ask Pacman to install htop with the command:
sudo pacman -S htop
REHL/CentOS
For REHL, use the command
sudo yum install htop
Once you have the htop utility installed successfully, we can proceed with the tutorial.
Htop Basic Usage
To start htop, all you need to do is run the command htop in your terminal session. Running this command will launch an interactive session allowing you to browse through your system resources.
An example of htop window is below:
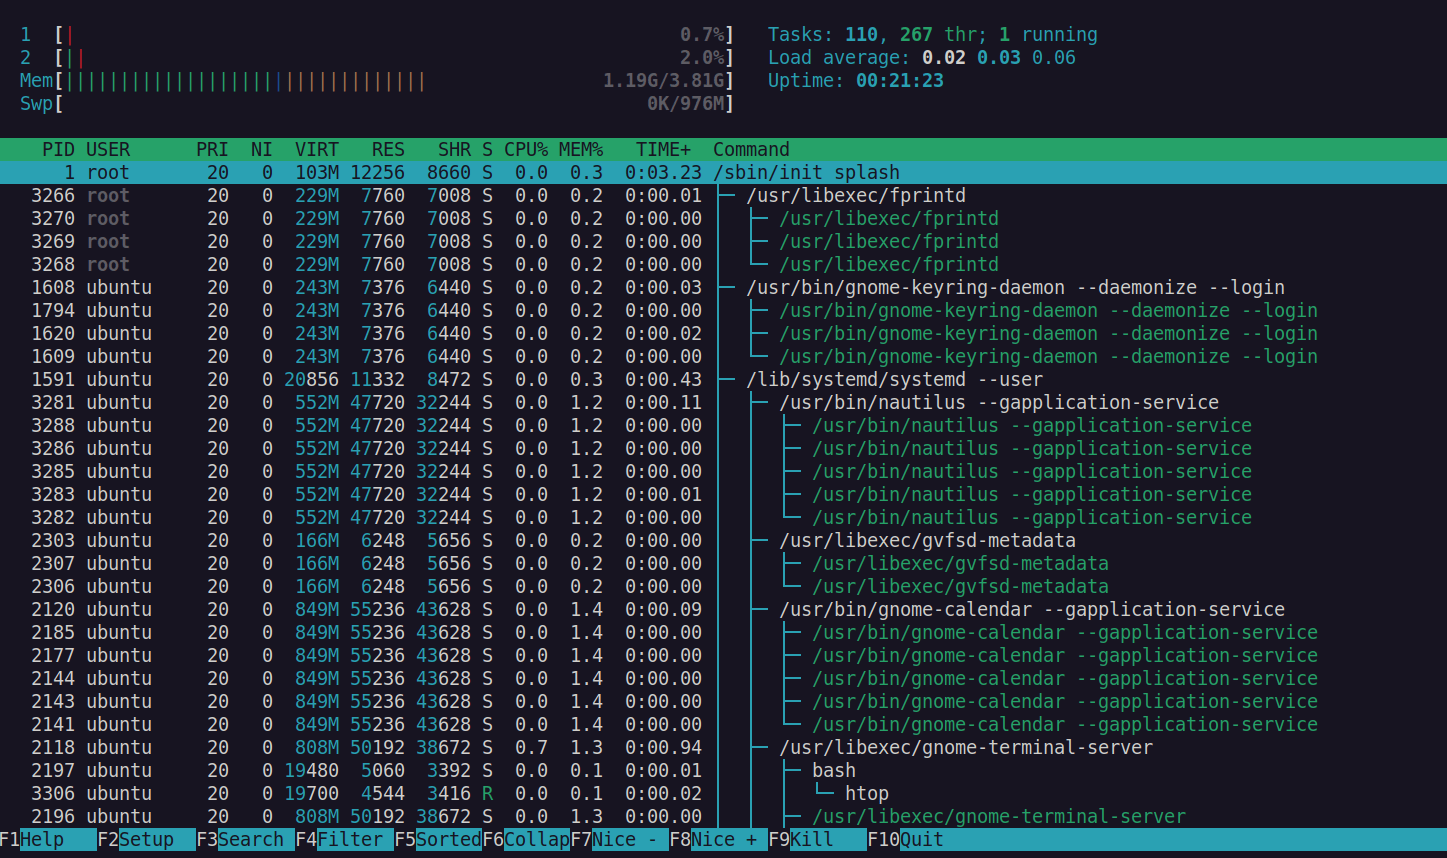
It may look intimidating, especially if you are used to the normal task manager such as System monitor but, htop is incredibly intuitive to use.
The bottom of the screen shows keyboard shortcuts you can use to perform various tasks inside the task manager.
Filter processes
Let us start by learning how to filter processes using htop. As you can see from the bottom screen, to filter for processes, press the F4 key on your keyboard.
Pressing this key will bring up an input field where you can set the parameters to filter. For example, let us filter for processes running as the ubuntu user or containing the keyword ubuntu.
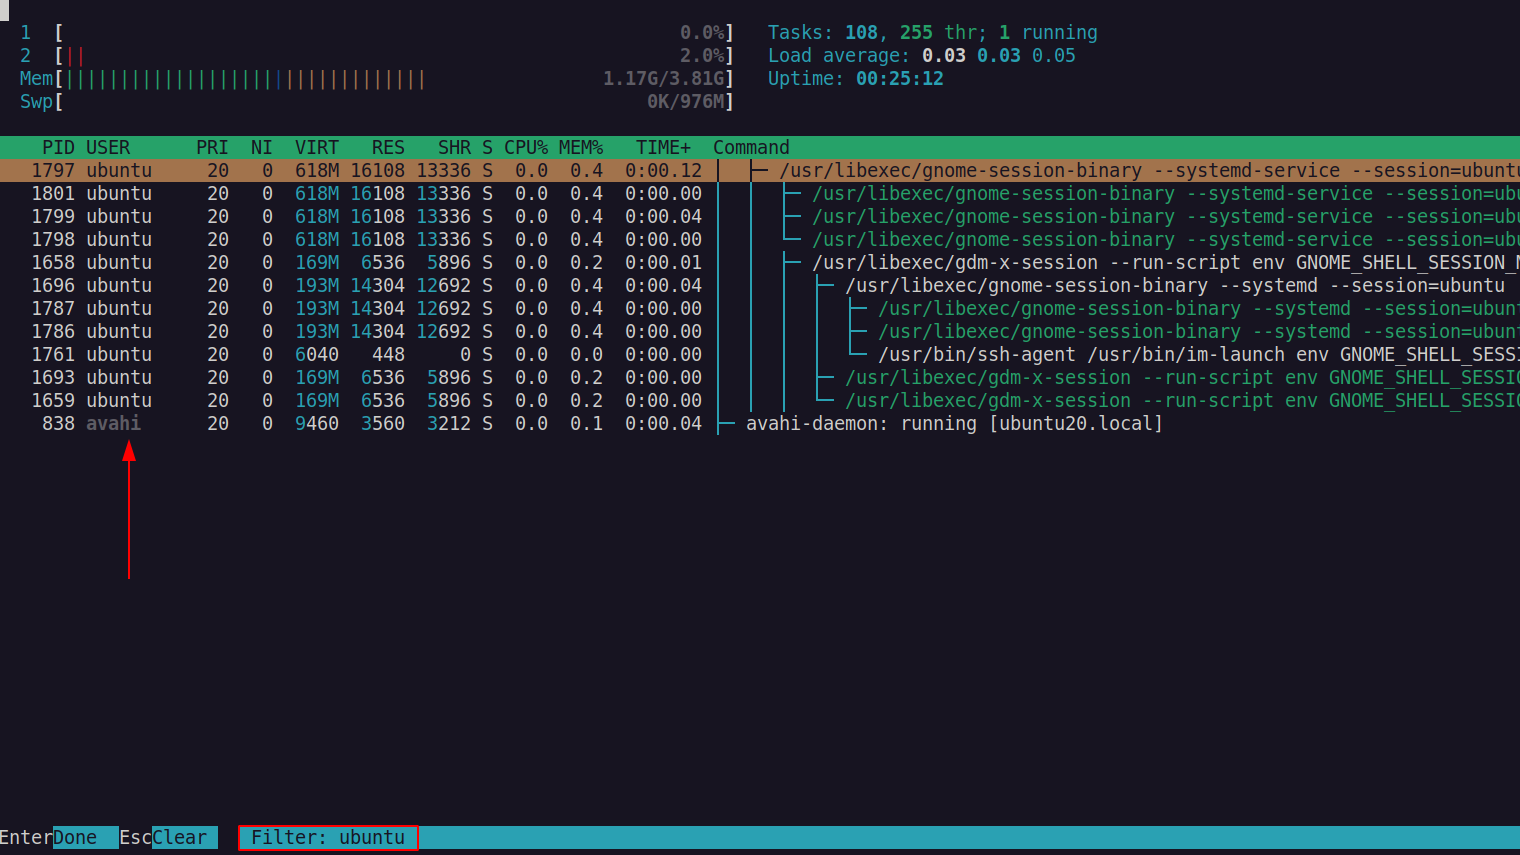
As you type, htop interactively filters for the string literals, which can be very helpful if you are not sure of the full process name.
Once you are satisfied with the filter, you can stay at the window showing only the filtered processes by pressing RETURN.
You can also quit the filter windows by pressing the ESC key. That will return to the main htop window.
Sort Processes
Htop also allows you to sort processes based on various parameters. These include:
- Process ID
- User
- Priority
- Nice
- Memory size
- Memory share
- Memory resident
- State
- Percentage CPU
- Percentage Memory
- Time
- Command
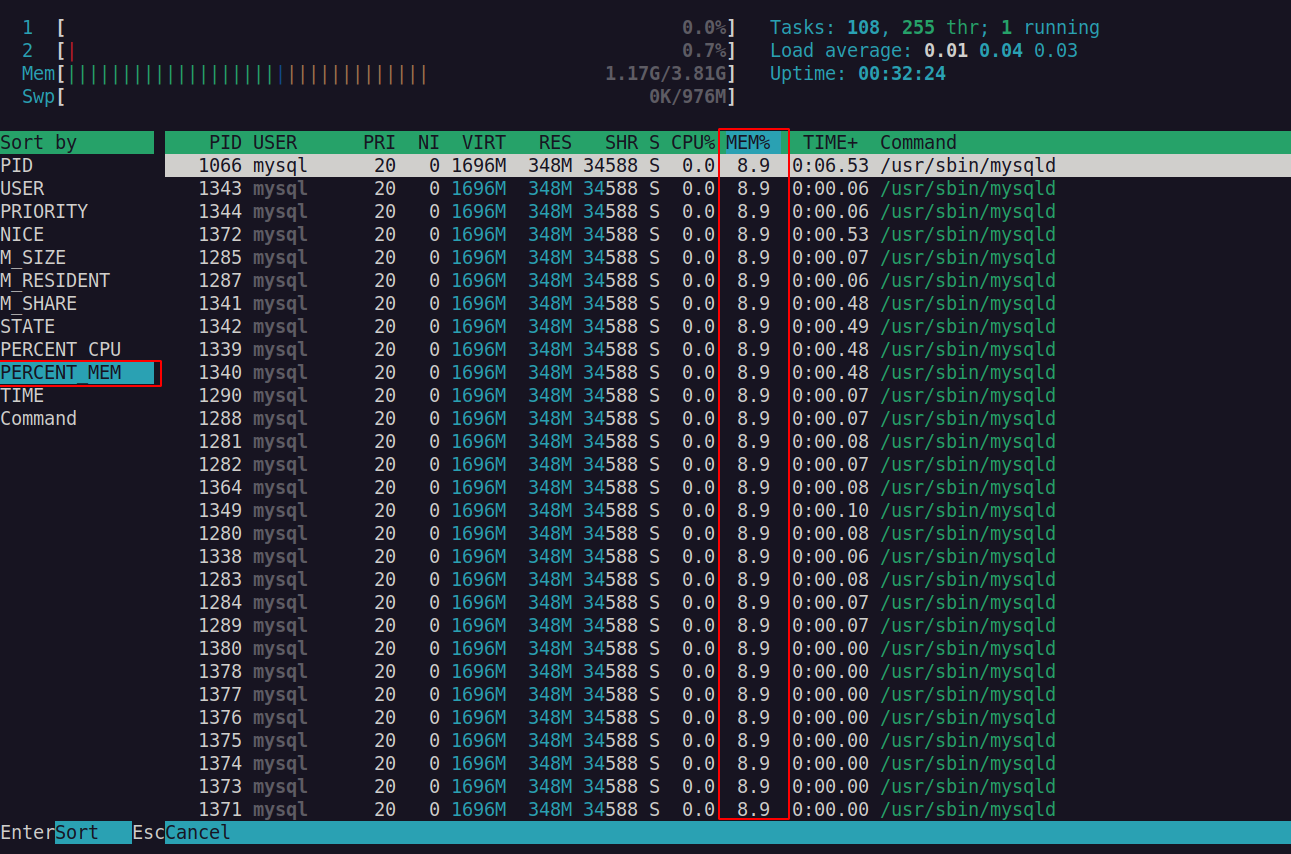
To sort commands, press the F6 key. That will bring up a side menu that allows you to select the sort parameter.
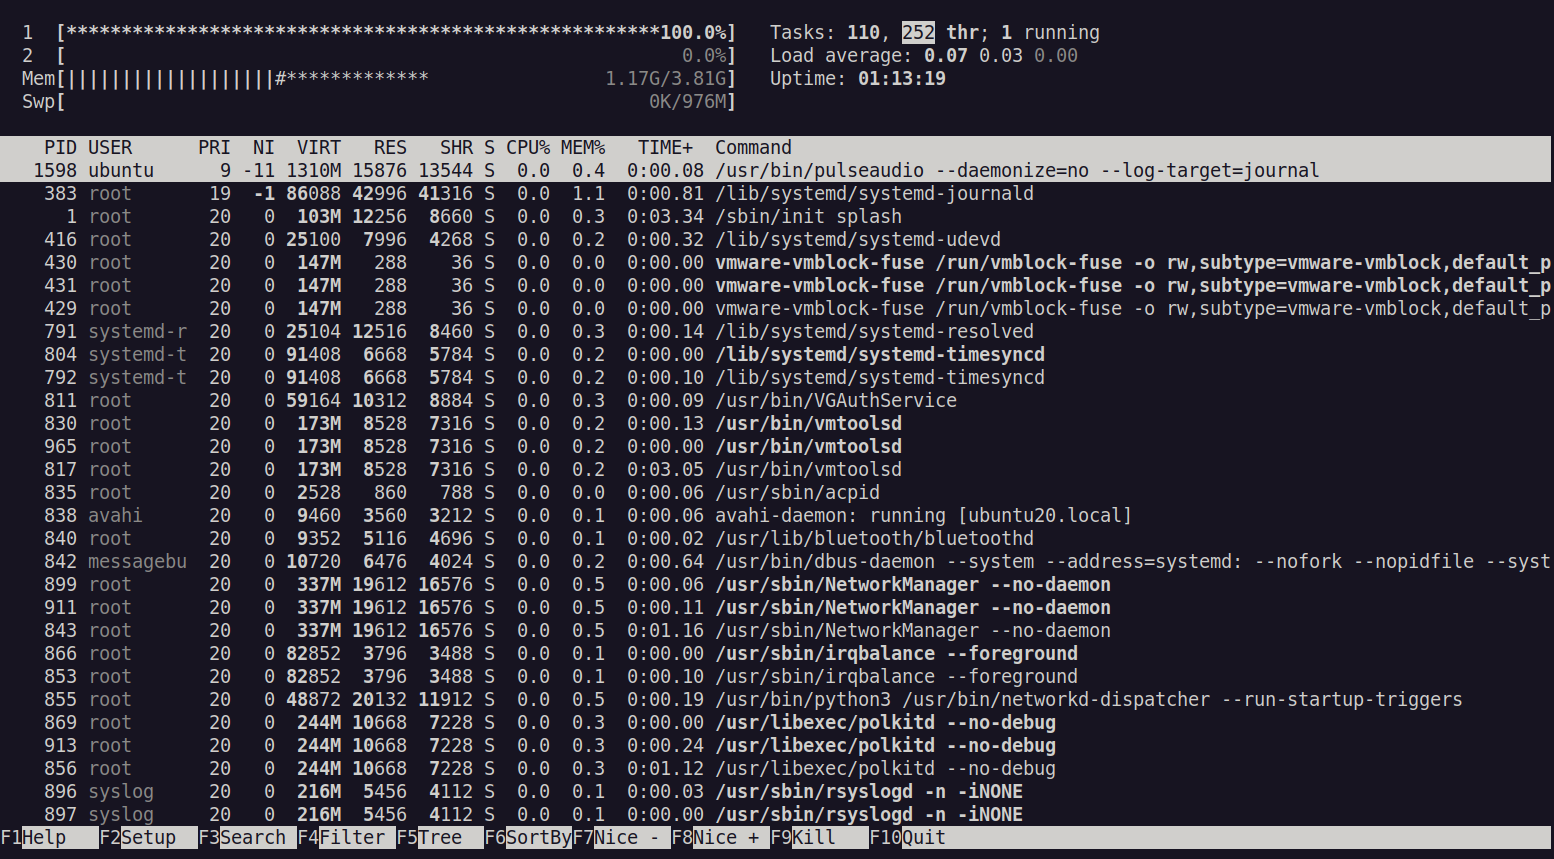
For example, to sort by memory percentage, on the sort by menu, select PERCENTAGE_MEM and press Enter.
This should show all the processes sorted by memory percentage usage in Ascending order. Here is an example output:
Killing Processes
And now, for the widespread use of the task manager, killing processes. Htop allows a quick and easy method to kill a process inside the session.
To do this, highlight the process you wish to terminate. You can do this by simply scrolling to using your up and down arrow keys. Once you have selected the processes, simply press f9 and enter to send the kill signal.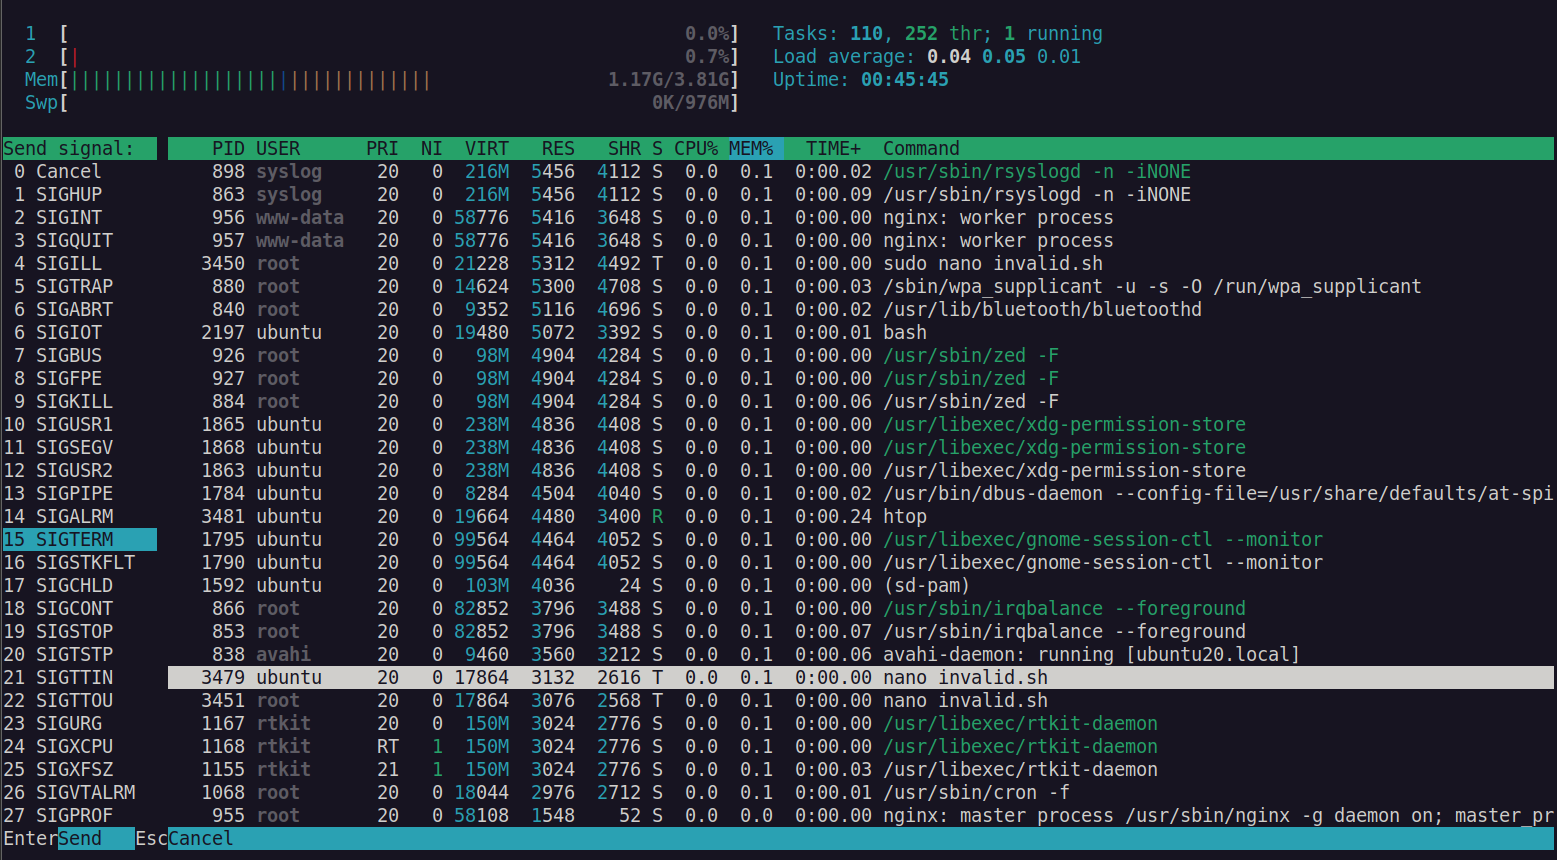
Upon pressing the F9 key, Htop provides you the signal type you can send (Consider the GNU C library manual to learn about IPC communication and signals). In our case, we need the Termination signal or SIGTERM.
Side Note: SIGTEM signal can be blocked, handled, and ignored.
https://www.gnu.org/software/libc/manual/html_node/
Remember, just because you can kill a process does not mean you should. Be mindful of the processes you terminate.
What’s Up With The Colors: What Do They Mean?
Up to this point, we have only discussed the bottom part of the htop. But what about the top bar. What is the deal with all the colors, and what do they mean?
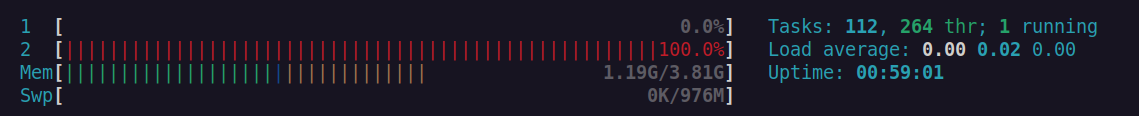
The color bars are organized as CPU and Memory. Here is what they mean.
CPU color bars
In the CPU section, the following colors represent:
- Dark Blue – Indicates CPU percentage used by low priority processes. Low processes in htop are indicated by an excellent value of greater than 0.
- Green – shows processes running as regular users in the system.
- Red – shows kernel threads.
- Aqua Blue – shows virtualized processes.
Memory color bars
For the memory section, the colors are presented as follows:
- Green – Shows used memory.
- Dark Blue – shows memory buffer pages
- Orange – shows memory allocated to cache.
For a quick shortcut to know what the colors mean in the htop, press the F1 key to bring up the help menu.
TIP: To start htop with no colors (monochrome mode), use the -C option as shown in the screenshot below:
Conclusion
I still believe htop is the best task manager and process manager for Linux systems. It offers incredible features in a simple, intuitive, and organized manner, making it a very easy and efficient choice for terminal geeks.
Using this tutorial, you should have enough basic usage concepts to help you use htop and expand your knowledge of the tool. For detailed information, consider the manual.