Linux provides a wealth of debugging tools for troubleshooting services and applications. A beneficial tool to developers is the Linux strace command. The strace command is a debugging and troubleshooting tool that intercepts and records system calls made and received by a process. It provides an elaborate binary sequence from the beginning right to the end.
In this tutorial, we delve into the Linux strace command and demonstrate a few example usages.
Basic command syntax
The strace command takes the following syntax:
How to install Linux strace command
Most modern Linux distributions ship with strace utility by default. However, if strace is not installed on your system for whatever reason, follow the steps below to install it.
On Debian / Ubuntu
If you are running Debian / Ubuntu-based systems, execute:
$ sudo apt install strace
On RHEL / CentOS
$ sudo yum install strace
To verify that strace is installed, you can check its version as shown.
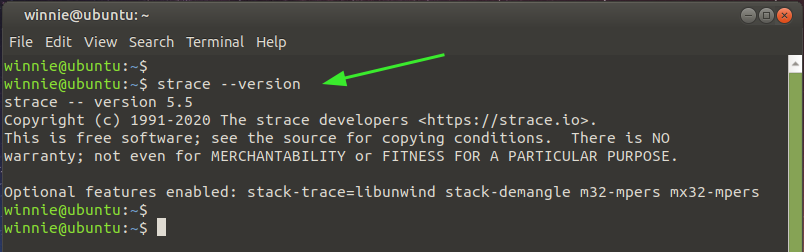
Let’s now check out a few example usages.
Basic strace command
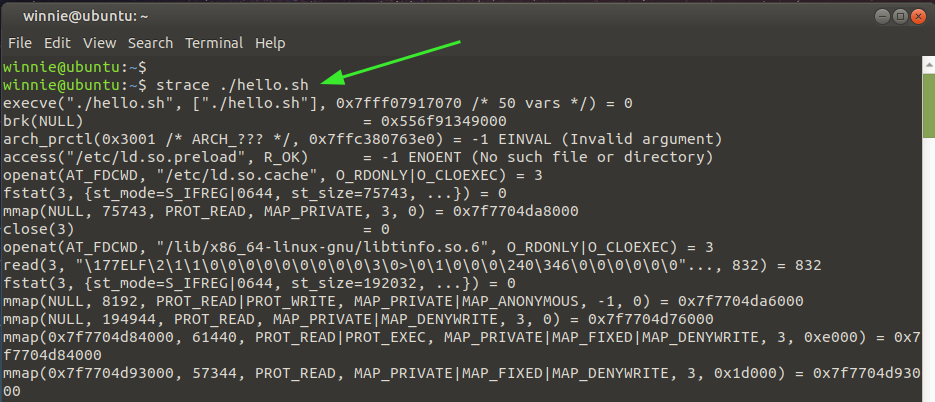
In its most basic format, the strace command will trace and display system calls, the arguments (enclosed in square braces or parenthesis), and the executable call.
In the example below, we can see the arguments of running the script hello.sh, call enclosed in parenthesis in the first line.
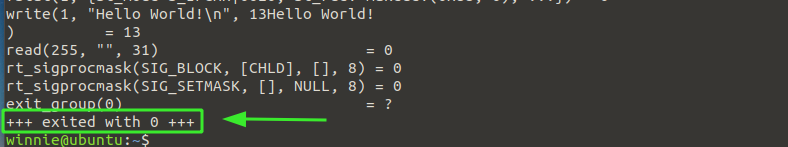
At the very last line, you can see the exit status of the command, in this case, 0. This implies that the command was executed successfully without any error. An exit code of -1 signifies that an error was encountered during execution.
Count the system calls
If you want to get the number of system calls, use the -c option for the count as shown.
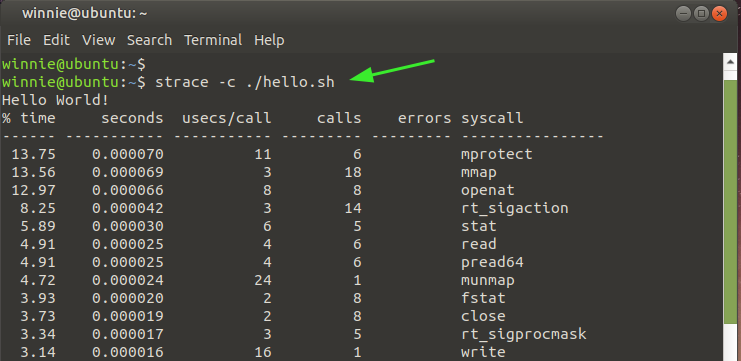
From the output above, you can see the number of system calls made, including making the calls.
Display specific system calls with strace
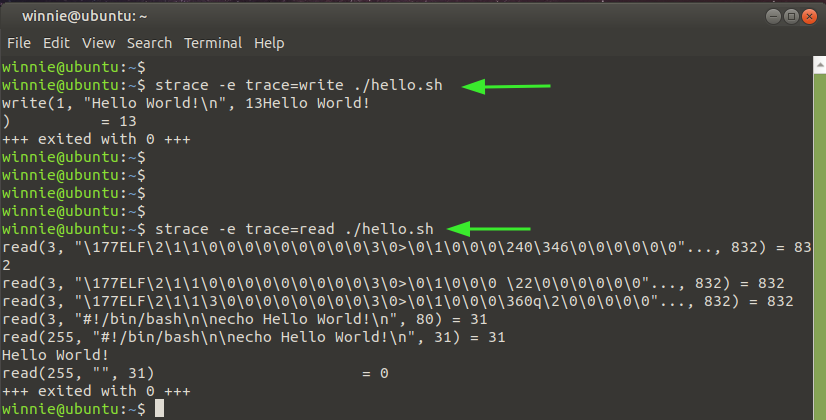
Additionally, you can choose to view the nature of system calls made with strace using the -e option followed by the nature of the system call. In the snippet shown, we have displayed the write and read system calls.
$ strace -e trace=read ./hello.sh
Trace network system calls
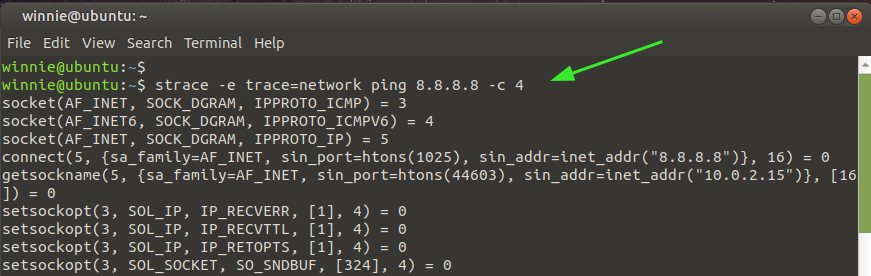
You can restrict strace to displaying network system calls by specifying the type of call. Here. trace=network indicates that we intend to get the network call of the network command ping 8.8.8.8 -c 4.
$ strace -e trace=network ping 8.8.8.8 -c 4
Trace signal system calls
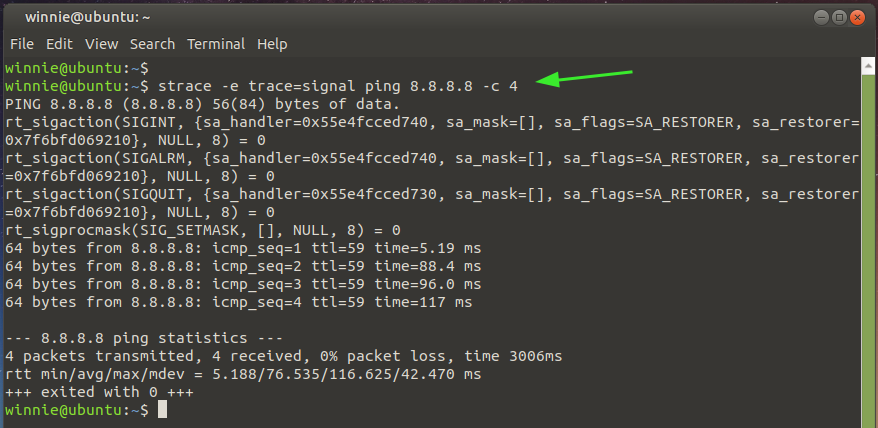
For system-related calls, use the argument as indicated in the command below. The command prints out the signal-caller for the ping 8.8.8.8 -c 4 command.
$ strace -e trace=signal ping 8.8.8.8 -c 4
Printing the timestamp of each system call
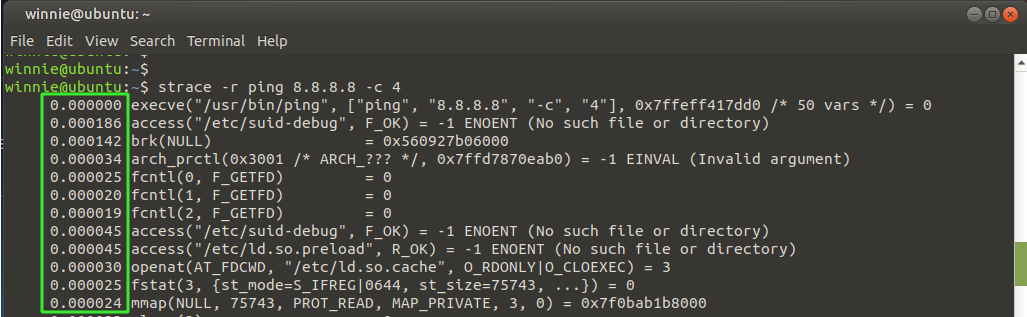
To extract the timestamp for each system call, use the -r option as demonstrated in the following command.
$ strace -r ping 8.8.8.8 -c 4
As you can see, a relative timestamp is printed for each system call. The time difference between successive system calls is captured and recorded.
Display the duration spent on making system calls
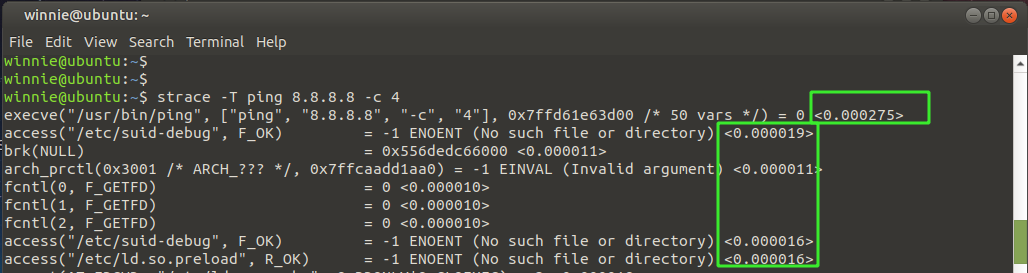
In addition, you can print out the duration of time spent for every system call using the -T option as shown. The time spent is indicated in the very last column as indicated.
$ strace -T ping 8.8.8.8 -c 4
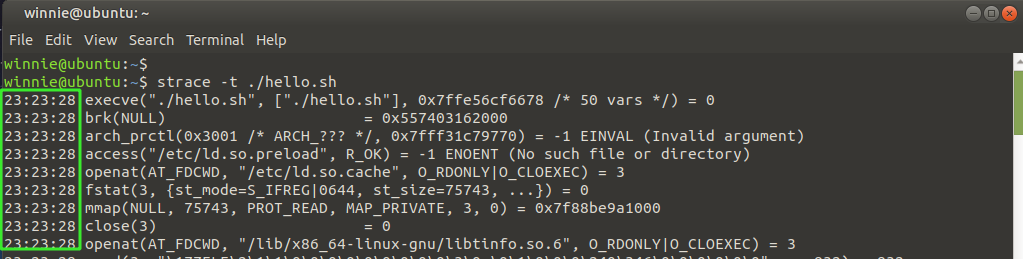
Display the exact time of each system call
To print the actual or exact time of the system calls, invoke the -t option as shown. The real-time or wall clock time is printed in the first column.
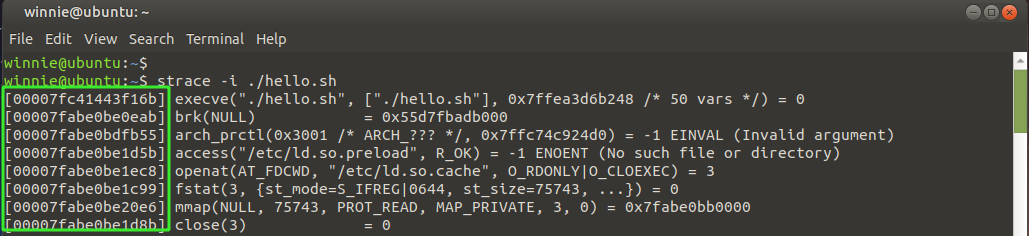
Display the instruction pointer for each call
To print the instruction pointer for every system call, use the -i option.
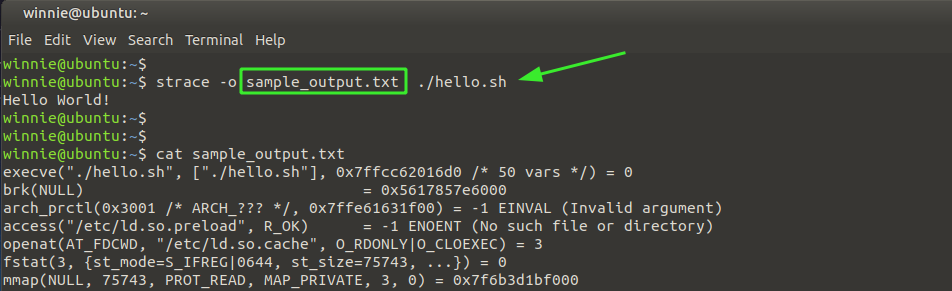
Save the output of system calls to a text file
Finally, the strace command gives you the option of saving the output to a text file, as shown.
$ strace -o sample_output.txt ./hello.sh
Here, sample_output.txt is the output file, while ./hello.sh is the command whose system calls we are tracing.
Wrapping up
The Strace command is a handy and powerful command-line utility that helps debug applications, commands, and processes, especially if you don’t have the source code available. It’s the go-to tool of choice for software developers and system administrators.